
Mastering Linear Regression: The Ultimate Guide for Data Scientists
Understanding the basic concepts of Logistic Regression.


What is logistic regression?
Logistic regression is an algorithm that is used for binary classification. The binary classification means that either the predicted outcome is true or false, yes or no, 0 or 1 etc… Logistic regression’s main purpose is to classify predicted outcomes.
Let us understand logistic regression in simple terms with an example. Let’s understand whether the student will pass or fail the exam based on the number of hours he studied. If the student has put more hours into studying then he will likely pass the exam. and if he studied for fewer hours then he will likely fail the exam. Based on the above example we can create the logistic regression model. So that we can predict whether a student will pass or not based on the number of hours he studied.
Attribution: Michaelg2015, CC BY-SA 4.0, via Wikimedia Commons
Logistic regression is a useful tool for predicting probabilities. It is simple to implement and easy to interpret. It is widely used in a variety of fields, including marketing, finance, and healthcare.
The formula of logistic regression—

This formula is also called the logistic function or sigmoid function.
- y is the probability of the outcome, and x is the predictor variable.
- x1,x2, and x3 are the values of the predictor variable.
- m1,m2,m3 … mn are the coefficients of the predictor variable.
- e is the base of the natural logarithm (approximately 2.718)
The sigmoid function maps every input value to 0 or 1. This way we can easily find the possibility of any outcome.
Cost function —
The cost function is the indicator of logistic regressions’ performance. The cost function measures how well the model is able to predict the correct outcome of the predictor variable. The cost function is used to optimize the logistic regression function. It is used to find the best coefficients (weights) so that model can make the most accurate predictions. To find the best coefficients, a gradient descent algorithm is used to minimize the cost function.

The cost function of logistic regression works on the maximum likelihood principle. It means that we are trying to find the coefficients that maximise the probability of correctly predicting the outcome.
Confusion matrix —
The confusion matrix is a table used to evaluate the performance of the classification model. It is also known as an error matrix, and it is a specific table layout that allows visualization of the performance of an algorithm. It is a way to visualize the model's predictions and compare them with true values(labels).
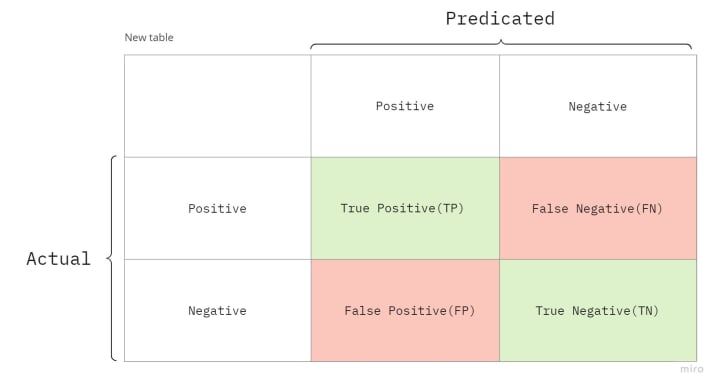
The rows of the confusion matrix represent the actual classes, and the columns represent the predicted classes. There are four possible outcomes for each prediction:
True positive (TP): The model correctly predicted the positive class (e.g., a student passed an exam).
False positive (FP): The model incorrectly predicted the positive class (e.g., a student failed an exam but the model predicted that they would pass).
False negative (FN): The model incorrectly predicted the negative class (e.g., a student passed an exam but the model predicted that they would fail).
True negative (TN): The model correctly predicted the negative class (e.g., a student failed an exam).
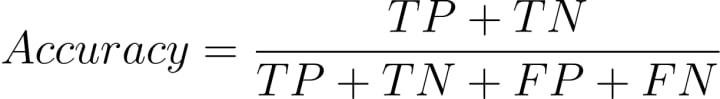
The confusion matrix can is used to calculate accuracy, precision, recall, and F1 score. These metrics can help us understand how well the model is performing.
Here is a brief explanation of each metric —
Accuracy: Accuracy is the proportion of correct predictions made by the model. A model with high accuracy is able to make a large number of correct predictions.
Precision: Precision is the proportion of positive predictions that are actually correct. A model with high precision is able to make a large number of correct positive predictions.

Recall: Recall is the proportion of actual positive cases that were correctly predicted by the model. A model with high recall is able to correctly identify a large number of positive cases.

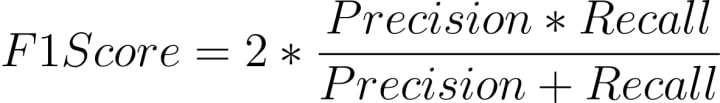
F1 score: The F1 score is a balance between precision and recall. It is a useful metric when we want to balance the importance of precision and recall. A model with a high F1 score is able to make a large number of correct positive predictions and correctly identify a large number of positive cases.
There are a few assumptions that must be met in order for a logistic regression model to be valid:
- The dependent variable (i.e., the outcome variable) must be binary. Logistic regression is only suitable for predicting a binary outcome (e.g., pass or fail).
- The independent variables (i.e., the predictor variables) must be independent of each other. This means that the predictor variables should not be highly correlated with each other. This can lead to unstable and unreliable results.
- There should be a sufficient sample size. Logistic regression requires a sufficient number of observations. As a general rule, the sample size should be at least 10 times the number of predictor variables.
- There should be no missing data. Logistic regression is sensitive to missing data, so it is important to ensure that there are no missing values in the data set.
There are multiple types of logistic regression used today for different use cases.
- Binary logistic regression: This is the most common type of logistic regression. Binary logistics is used to predict a binary outcome based on one or more predictor variables.
- Multinomial logistic regression: This type of logistic regression is used to predict a categorical outcome with more than two categories. It is similar to binary logistic regression. It uses multiple logistic regression models (one for each category) instead of just one.
- Ordinal logistic regression: This type of logistic regression is used to predict an ordinal outcome (e.g., a student’s grade on an exam as a letter grade). It is similar to binary logistic regression, but it takes into account the ordinal nature of the outcome (e.g., A > B > C).
- Nominal logistic regression: This type of logistic regression is used to predict a categorical outcome with two or more categories. It is similar to multinomial logistic regression. It does not assume a particular order between the categories.
Now let’s look into some real-life examples of logistic regression. There are multiple real-life applications of logistic regression in different sectors of our industries.
- Healthcare: Logistic regression can be used to predict the possibility of a patient developing a particular disease. It is based on various risk factors, such as age, gender, family history, and lifestyle factors. It can also be used to predict the likelihood of a patient responding to a particular treatment.
- Marketing: Logistic regression can be used to predict the likelihood of a customer making a purchase. There are many factors such as age, income, location, and purchasing history of a customer. It can also be used to predict the likelihood of a customer responding to a marketing campaign.
- Finance: Logistic regression can be used to predict the likelihood of a loan applicant defaulting on a loan. It can also be used to predict the likelihood of a stock price going up or down based on economic and market factors.
- Education: Logistic regression can be used to predict the likelihood of a student passing or failing an exam. This is based on factors such as hours studied, age, and school attended. It can also be used to predict the likelihood of a student graduating or dropping out of school based on various risk factors.
Overall, logistic regression is a simple yet powerful tool for solving binary classification problems, and it is a great starting point for many machine-learning problems.
I hope you have found this useful. Thank you for reading. Now start building your machine learning models and use them in real life to better understand the concepts. And do follow me on Medium, Twitter and Blogger.
About the Creator
Keep reading
More stories from writers in 01 and other communities.
What You Need to Know About Cloudflare Error Code 1010
While browsing a website, you might suddenly run into Cloudflare Error 1010, which blocks your access and disrupts your activity. For businesses, this can become a serious obstacle to traffic. If you rely on automated tools—like scrapers, bots, or API clients—this error can bring your entire workflow to a standstill.
By Swiftproxy7 days ago in 01
iPhone 18 Pro & Pro Max: The 10 Biggest Leaks and Rumors You Need to Know
So, here we are in 2026, summer is almost in the rear-view mirror, and that can only mean one thing: Apple season is right around the corner. A brand-new iPhone is coming, and more importantly, a brand-new iPhone 18 Pro and iPhone 18 Pro Max are nearly here.
By Bella Anderson3 days ago in 01


Comments
There are no comments for this story
Be the first to respond and start the conversation.