
Candlestick Trading Strategies: Step-by-Step Guide for Entry and Exit
Master candlestick trading strategies with confirmation candles, price rejection, and confluence zones for precise entry and exit in Forex, stocks, and crypto

Candlestick charts are more than just a way to visualize price; they are a window into market psychology. For centuries, since their development in Japan for rice trading, these patterns have helped traders gauge the battle between bulls and bears. A successful trading plan using candlesticks moves beyond merely recognizing shapes. It involves a deep understanding of context, confirmation, and confluence to execute high-probability candlestick-based setups. This guide will provide a comprehensive, step-by-step framework for developing your own entry and exit strategy using candlestick trading strategies.
Introduction to Candlestick Trading
At its core, every candlestick tells a story of the open, high, low, and close within a specific timeframe. The body and wicks (or shadows) provide immediate visual cues about buying and selling pressure. Bullish and bearish patterns, formed by one or multiple candles, are the building blocks of price action trading.
The key difference between a novice and a proficient trader lies in the application. While a beginner might enter a trade as soon as they see a Hammer, an advanced trader understands that patterns are signals, not commands. The true power of candlestick trading strategies is unlocked when they are used to improve the timing of your entry and exit strategy within the broader market context.
Understanding Confirmation Candles
A confirmation candle is the candle that closes after a candlestick pattern has formed, validating the signal it provided. Relying on a pattern before it is confirmed is like stepping off a curb based on a green light you saw a second ago—the situation may have changed.
Definition and Purpose:
A confirmation candle provides the proof that the momentum suggested by the initial pattern is actually being followed by the market. It significantly reduces false signals and prevents you from buying at the top of a move or selling at the bottom.
How to Identify Valid Confirmation Signals:
For Bullish Reversal Patterns (e.g., Hammer, Bullish Engulfing): A valid confirmation candle is a bullish candle that closes above the high of the pattern candle.
For Bearish Reversal Patterns (e.g., Shooting Star, Bearish Engulfing): A valid confirmation candle is a bearish candle that closes below the low of the pattern candle.
Example:
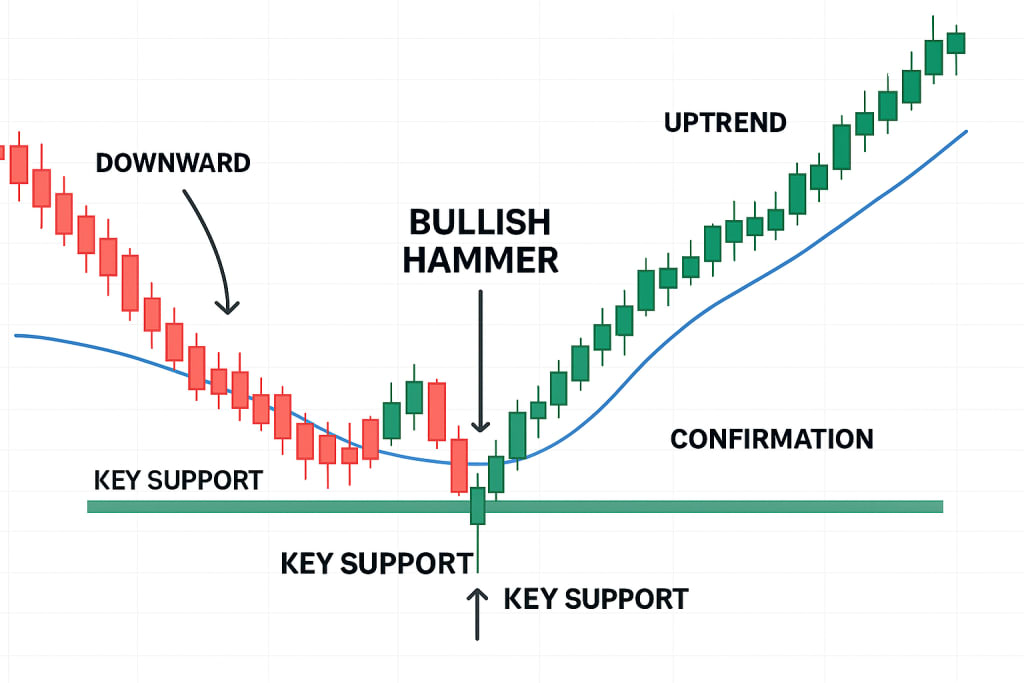
You spot a bullish Hammer pattern at a key support level. Instead of buying immediately, you wait for the next candle to close. If the next candle is bullish and closes above the Hammer's high, this is your confirmation to enter a long trade.
Price Rejection and Its Role in Trading
Price rejection is a fundamental concept in candlestick analysis. It occurs when the price moves significantly away from a level but is forcefully rejected, closing back near its opening price. This is visually represented by long wicks or shadows on the candles.
What It Indicates:
A long lower wick (a tail) indicates that sellers pushed the price down, but buyers were strong enough to reject those lower prices and push the price back up. This is a sign of buying pressure. Conversely, a long upper wick indicates that buyers pushed the price up, but sellers overwhelmed them and rejected the higher prices.
Recognizing False Breakouts:
Price rejection is exceptionally useful for spotting false breakouts. If the price breaks above a resistance level but forms a candle with a very long upper wick that closes back below resistance (a pattern like a Shooting Star), it signals a false breakout and a potential reversal. This is a powerful reversal candlestick setup.
Using Confluence Zones
A candlestick pattern in isolation is a weak signal. A candlestick pattern within a confluence zones is a high-probability trade setup. Confluence occurs when multiple technical analysis factors align at the same price level.
Definition of Confluence Zones:
These are areas on the chart where two or more of the following converge:
Support and Resistance (horizontal levels, trendlines)
Key Moving Averages (e.g., 50, 100, or 200-period EMA)
Fibonacci Retracement Levels (e.g., 61.8%)
Previous Swing Highs or Lows
How Confluence Enhances Trade Reliability:
When a reversal candlestick setup like a Doji or Engulfing Pattern appears precisely at a confluence zones, the likelihood of a successful trade increases exponentially. The zone provides the "why" for the pattern's formation—it's a level where the market has historically made decisions.
Entry Strategies with Candlesticks
Here is a step-by-step approach to entering trades using candlestick-based setups.
Step-by-Step Entry Process:
Identify the Trend and Key Confluence Zone: Use a higher timeframe (e.g., Daily or H4) to identify the overall trend and a significant confluence zones (e.g., a support level that aligns with the 200-day EMA).
Wait for Price to Approach the Zone: Watch as price enters your pre-identified zone on your trading timeframe (e.g., H1 or M15).
Look for a Candlestick Signal: As price touches the zone, watch for a reversal candlestick setup (e.g., Bullish Engulfing at support, Bearish Engulfing at resistance).
Wait for the Confirmation Candle: Do not enter immediately. Wait for the candle after the pattern to close as a confirmation candle.
Execute the Entry: Enter the trade on the close of the confirmation candle or on a retest of the pattern's extreme.
Examples:
Bullish Entry: Price approaches a strong support + 50 EMA confluence. A Bullish Engulfing pattern forms. You enter a long position after the next candle closes above the high of the Engulfing candle.
Bearish Entry: Price rallies into a resistance trendline + 78.6% Fibonacci level. A Shooting Star pattern forms. You enter a short position after the next candle closes below the low of the Shooting Star.
Entry Timing with Multi-Timeframe Analysis:
For even greater precision, use a three-timeframe framework. Use the higher timeframe for trend and zone identification, the middle timeframe for the pattern, and the lower timeframe for a precise entry.
Exit Strategies Using Candlestick Patterns

A profitable trade requires a well-defined entry and exit strategy. Candlesticks are just as effective for exiting as they are for entering.
Setting Stop-Loss (SL):
Your stop-loss should be placed just beyond the level that invalidates your trade idea.
For a long trade based on a bullish pattern at support, place your SL below the low of the pattern candle or the support level.
For a short trade based on a bearish pattern at resistance, place your SL above the high of the pattern candle or the resistance level.
Setting Take-Profit (TP) and Trailing Stops:
Fixed Take-Profit: You can set a TP at the next logical resistance (for longs) or support (for shorts) level.
Trailing Stop with Candles: A more dynamic approach is to use candlestick logic to trail your stop. For a long trade, you could move your stop-loss to below the low of each successive bullish candle's low. Exit the trade when a bearish confirmation candle breaks a recent swing low or a key moving average, signaling that the trend continuation signals may be exhausted.
Risk Management in Candlestick Trading
Even the best candlestick strategy examples fail without proper risk management.
Position Sizing: Never risk more than 1-2% of your trading capital on a single trade. The size of your position should be calculated based on the distance between your entry and your stop-loss.
Avoid Overtrading: Not every candlestick pattern is a valid signal. By insisting on confirmation candle and confluence zones, you automatically filter out low-quality setups and avoid overtrading.
Pattern Strength: A Doji at a minor level is weak. A Morning Star pattern at a major confluence zone is strong. Adjust your position size accordingly, taking smaller risks on weaker setups.
Advanced Candlestick Trading Techniques
Combining with Indicators:
Use oscillators like the RSI or MACD to add momentum confirmation to your candlestick signals. For example, a Bullish Engulfing pattern at support is far more potent if the RSI is also in oversold territory (<30) and showing bullish divergence.
Multi-Timeframe Analysis (MTFA):
This is a cornerstone of advanced trading. A bullish pattern on the H1 chart is much more significant if the Daily chart is also in a bullish trend. MTFA helps you trade in the direction of the dominant momentum, aligning your candlestick-based setups with the larger market flow.
Real Market Examples and Case Studies
Example 1: Bearish Reversal in Bitcoin (BTC/USD)
(See Annotated Chart Concept)
Context: BTC is in an uptrend but is approaching a prior all-time high (a major resistance confluence zones).
Signal: After touching the resistance, a bearish Shooting Star pattern forms, showing clear price rejection at the top.
Confirmation: The next candle is a large bearish candle that closes below the low of the Shooting Star. This is the confirmation candle and the entry signal for a short trade.
Exit: The stop-loss is placed above the high of the Shooting Star. The trade is exited when a bullish Hammer forms at a lower support level, signaling a potential pause in the downtrend.
Example 2: Bullish Continuation in a Stock (AAPL)
Context: AAPL is in a steady uptrend, pulling back to its 50-day EMA (a dynamic support confluence zones).
Signal: A Bullish Harami pattern forms right on the EMA.
Confirmation & Entry: The next candle is a strong bullish confirmation candle that closes above the Harami's high. This is a classic trend continuation signal and a long entry.
Risk Management: The stop-loss is placed below the low of the Harami pattern.
Common Mistakes and How to Avoid Them
Misreading Patterns: A small-bodied candle with equal wicks is a Doji (indecision), not a Spinning Top (which has a more defined body). Study the exact criteria for each pattern.
Ignoring Market Context: Trading a bullish pattern in a strong downtrend is fighting the momentum. Always align your candlestick trading strategies with the prevailing trend.
Over-reliance on Single Candles: A single Hammer is not a strategy. It is a single component. The most successful traders use the holistic approach outlined in this guide: Pattern + Confirmation + Confluence.
Conclusion and Best Practices
Mastering candlestick trading strategies is a journey that blends art and science. The patterns provide the science—the clear, actionable signals. The art lies in interpreting them within the context of the market's narrative.
To summarize the key strategies for a confident entry and exit strategy:
Never trade a pattern without a confirmation candle.
Always seek out confluence zones to add weight to your signals.
Understand and look for price rejection as a core component of pattern logic.
Integrate multi-timeframe analysis and simple indicators for higher-probability setups.
The best way to internalize these concepts is through practice. Use a demo account to backtest and forward-test these candlestick strategy examples without risking real capital. Combine these powerful candlestick-based setups with a disciplined trading plan, and you will have a robust framework for navigating the financial markets.
About the Creator
MEXQUICK
Beyond Market Move - At MEXQuick, we combine smart trading infrastructure with global market access — offering users a seamless way to trade, learn, and grow. MEXQuick News & MEXQuick News
Understanding Crossdressing Culture and Modern Crossdresser Shops in Australia
Crossdressing refers to the act of wearing clothing traditionally associated with another gender. Throughout history, people have practiced crossdressing for cultural, theatrical, personal, or social reasons. Historical records show that crossdressing has appeared in many civilizations, including ancient societies where clothing and gender roles were more fluid than often assumed.
By James Mburu4 days ago in 01
Multi Directional Forklift: The Future of Flexible Warehouse Handling
Modern warehouses and logistics centers rely heavily on efficient material‑handling equipment. Among the many machines used in warehouses, the Multi Directional Forklift stands out as one of the most versatile solutions for handling complex loads in tight spaces. As storage facilities become more compact and demand faster operations, businesses are increasingly adopting advanced forklifts that maximize space, safety, and productivity.
By charliesamuel3 days ago in 01
The Politics of Playing Dress-Up
Well, to start off I'd like to say a happy world book day to all who celebrate. I know I haven't really posted anything on my socials about it but I'm not a jubilant kind of person. I lay low most of the time. Let's start off with a popular anecdote from the vaults...
By Annie Kapur4 days ago in Geeks


Comments
There are no comments for this story
Be the first to respond and start the conversation.