
Candlestick Structure Explained: Body, Wick, and Colors
Discover how candlestick structure forms patterns, influences market sentiment, and helps traders make informed decisions. A complete guide for beginners.

For anyone stepping into the world of trading—be it stocks, forex, or crypto—the first encounter with a price chart can be intimidating. A chaotic mess of lines, bars, or colored rectangles seems to tell a story that only the initiated can understand. But what if you could learn to read this story? What if each of those colored shapes, known as candlesticks, was a rich source of information about the battle between buyers and sellers?
This is the power of candlestick structure. It is the foundational alphabet of market language. By understanding the basic components—the body and wick, and the profound meaning of candle colors—you transform from a passive observer into an active analyst. This comprehensive guide will deconstruct candlestick anatomy for you, providing the knowledge to interpret market sentiment, identify potential turning points, and build a stronger, more intuitive trading strategy.
Introduction to Candlestick Structure
What is a Candlestick in Trading?
A candlestick is a type of price chart used in technical analysis that displays the high, low, open, and closing prices of a security for a specific period. This period could be one minute, five minutes, one hour, one day, or even one week. Unlike a simple line chart that only shows the closing price, a candlestick packs a wealth of information into a single, visual unit.
The beauty of candlesticks lies in their origin. Developed in the 18th century by Japanese rice trader Munehisa Homma, they were designed to visualize not just the price, but the emotion and momentum of the market. Each candle tells a story of the struggle between bullish (buying) and bearish (selling) forces during its given time frame.
Importance of Understanding Candlestick Anatomy
Why should you, as a trader, invest time in learning candlestick anatomy? Because price is the ultimate leading indicator. While other indicators like the RSI or MACD are derived from price, candlesticks show you the raw price action itself.
Mastering the structure allows you to:
Gauge Market Sentiment Instantly: The size and color of a candle's body and the length of its wicks tell you who is in control.
Identify Key Price Levels: The high and low of a candle, defined by its wicks, highlight where price was rejected or accepted.
Anticipate Potential Reversals or Continuations: Specific formations, built from the basic structure, can signal a change in trend or a pause before the next move.
Make Informed Decisions: Instead of guessing, you base your entries, exits, and stop-losses on concrete price action evidence.
In essence, trading with candlesticks provides a framework for understanding the market's narrative, one candle at a time.
Components of a Candlestick: Deconstructing the Building Blocks
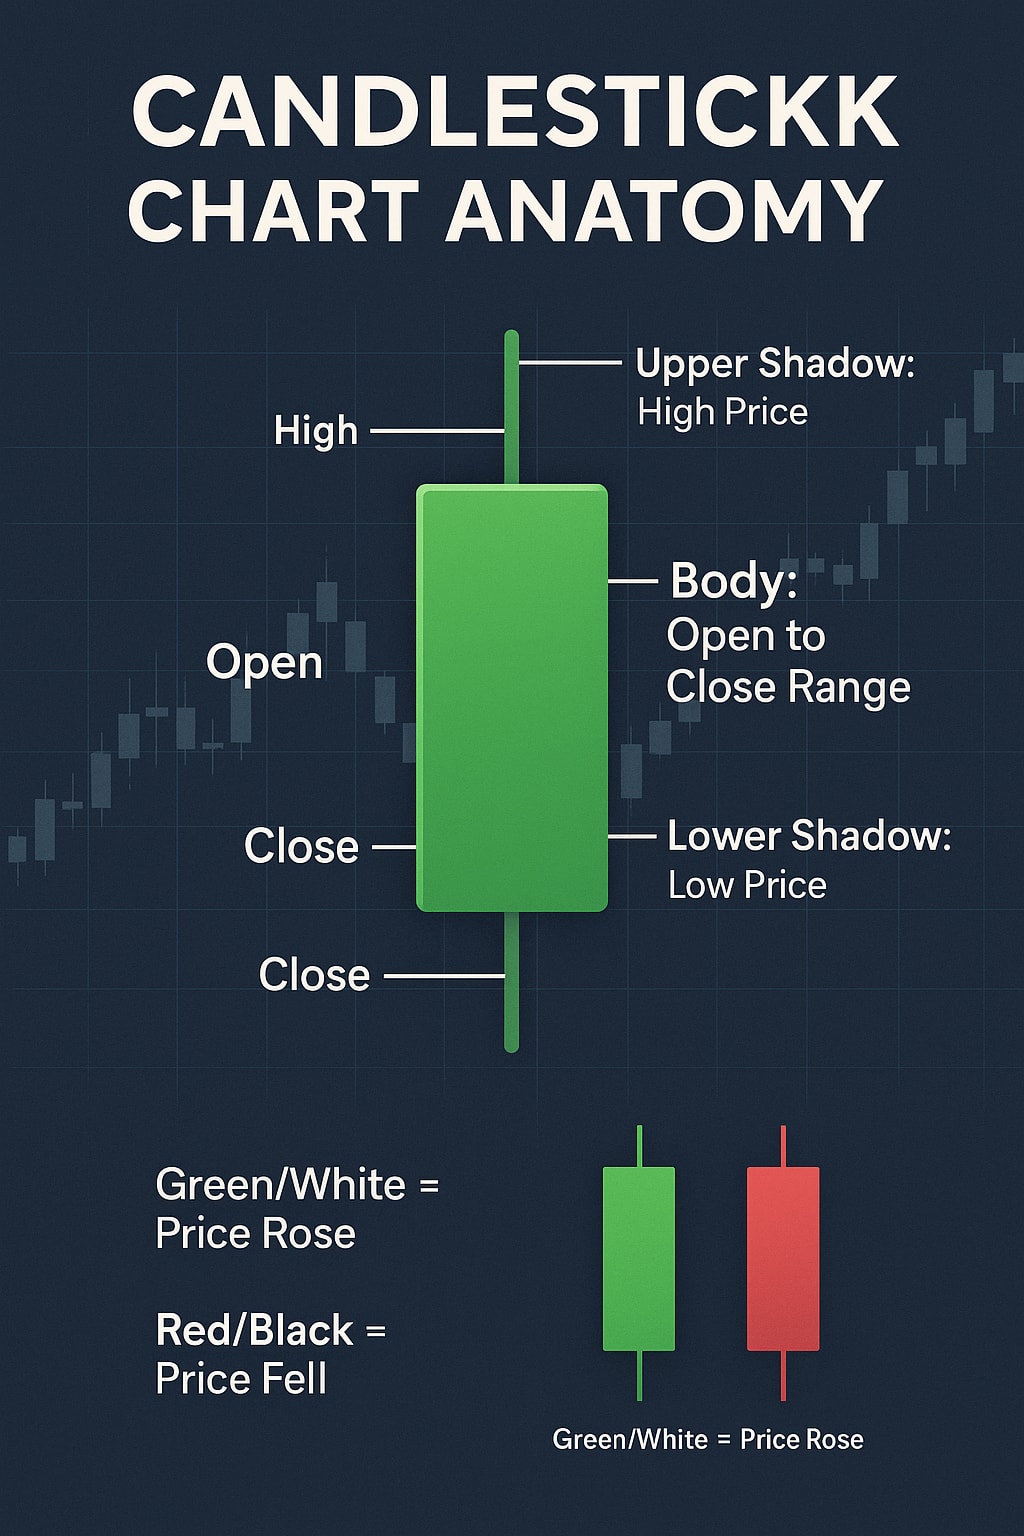
Every candlestick is composed of two primary parts: the body and the wick (or shadow). To fully grasp candlestick structure, we must break down what each of these parts represents.
The Body: The Heart of the Battle
The candle body is the wide, rectangular section between the open and close prices. It is the most critical part of the candle as it represents the core battle between buyers and sellers during the time period.
What it Shows: The body encapsulates the opening and closing prices. The top and bottom of the body are the open and close (or vice-versa, depending on the candle's color).
Interpretation: A long body indicates strong conviction. The price moved significantly from the open to the close, meaning one side (bulls or bears) dominated the session. A small body, often called a short body or doji, indicates indecision. The price opened and closed at very similar levels, suggesting a stalemate between buyers and sellers.
The Wick / Shadow: The Rejection Zones

The wick, also known as the shadow, is the thin line that protrudes from the top and/or bottom of the body. It represents the highest and lowest prices the asset reached during the time period.
Upper Shadow/Wick: This line extends from the top of the body to the highest price of the period. It signifies that price moved up but was rejected and pushed back down by sellers. A long upper shadow is a bearish signal for that period, showing that the buyers tried to push higher but failed.
Lower Shadow/Wick: This line extends from the bottom of the body to the lowest price of the period. It signifies that price moved down but was rejected and pushed back up by buyers. A long lower shadow is a bullish signal for that period, indicating that sellers tried to push lower but were overwhelmed by buyers.
Open, High, Low, Close (OHLC): The Raw Data
Every candlestick is a visual representation of four key data points, often abbreviated as OHLC:
Open: The price at which the asset started the trading period.
High: The highest price the asset reached during the period.
Low: The lowest price the asset reached during the period.
Close: The price at which the asset ended the trading period.
The relationship between these four values defines the candle's shape, color, and ultimately, its meaning.
Candle Colors and What They Mean
Color is the most immediate visual cue in candlestick structure. It provides an instant snapshot of who won the battle for that specific period.
Bullish Candle vs. Bearish Candle
Bullish Candle: This candle forms when the closing price is higher than the opening price. It signifies that buyers (bulls) were in control by the end of the period. The most common color conventions for a bullish candle are white (in classic charts) or green (in modern color schemes).
Bearish Candle: This candle forms when the closing price is lower than the opening price. It signifies that sellers (bears) were in control by the end of the period. The most common color conventions for a bearish candle are black (in classic charts) or red (in modern color schemes).
How Color Indicates Market Sentiment
The meaning of candle colors is directly tied to market psychology.
A Green/White Candle (Bullish): Shows optimism and buying pressure. The period ended with buyers willing to pay a higher price than the period's opening. A series of strong green candles indicates a strong uptrend.
A Red/Black Candle (Bearish): Shows pessimism and selling pressure. The period ended with sellers forcing the price down. A series of strong red candles indicates a strong downtrend.
It is crucial to remember that the color tells you who won the battle for that single period. A single green candle in a strong downtrend does not necessarily mean the trend has reversed; it might just be a temporary pause. This is why context, which we will discuss later, is king.
Candlestick Patterns Formed by Structure
The real power of candlestick analysis emerges when individual candles form specific shapes and when sequences of candles create recognizable patterns. These patterns are the direct result of the candlestick structure we've just learned.
Single Candle Patterns
These patterns are formed by a single candlestick and can provide powerful signals, especially at key market levels.
Doji: This is a prime example of indecision. A Doji has a very small or non-existent body, meaning the open and close are virtually the same. It has upper and lower shadows of varying lengths. The Doji signifies that buyers and sellers are in equilibrium, and a potential reversal may be imminent, especially after a strong trend.
Hammer: A bullish reversal pattern that forms at the bottom of a downtrend. It has a small body at the upper end of the trading range and a long lower shadow that is at least twice the length of the body. The long lower shadow shows that sellers pushed the price significantly lower, but buyers aggressively stepped in and drove the price back up to close near the open. This is a clear sign of a failed sell-off.
Shooting Star: The bearish counterpart to the Hammer. It forms at the top of an uptrend. It has a small body at the lower end of the trading range and a long upper shadow that is at least twice the length of the body. The long upper shadow shows that buyers pushed the price higher, but sellers aggressively stepped in and drove the price back down to close near the open. This signals a failed breakout.
Multi-Candle Patterns
These patterns involve two or more candles and provide even stronger signals due to the confirmation they offer.
Bullish Engulfing Pattern: A two-candle reversal pattern at the bottom of a downtrend. The first candle is a small bearish candle (red). The second candle is a large bullish candle (green) that completely "engulfs" the body of the first candle. This shows a dramatic shift in momentum from selling to buying.
Bearish Engulfing Pattern: The opposite of the bullish version. It appears at the top of an uptrend. The first candle is a small bullish candle (green). The second is a large bearish candle (red) that completely engulfs the first candle's body, signaling a strong shift from buying to selling.
Morning Star: A three-candle bullish reversal pattern. It consists of a long bearish candle (downtrend), a small-bodied candle (indecision/Doji) that gaps down, and a third long bullish candle that closes well into the body of the first candle. This shows a transition from selling to indecision to strong buying.
Evening Star: The bearish counterpart to the Morning Star. It appears at a top and consists of a long bullish candle, a small-bodied candle (indecision), and a third long bearish candle that closes well into the body of the first candle.
How Structure Creates Actionable Trading Signals
Each of these patterns is built from the basic components. A Hammer's signal comes from its long lower shadow. An Engulfing pattern's power comes from the stark contrast between a small body and a large, opposing-colored body. By understanding the anatomy, you don't just memorize patterns; you understand why they are significant, which is the key to trading with candlesticks effectively.
Using Candlestick Structure in Price Action Trading
Price action trading is a methodology that relies solely on the interpretation of price movements, of which candlesticks are the primary tool. Integrating candlestick structure into a price action framework is a natural and powerful combination.
Combining with Support and Resistance
Candlestick patterns are most potent when they appear at key support and resistance levels.
A Hammer or Bullish Engulfing pattern forming at a well-established support level provides a high-probability buy signal.
A Shooting Star or Bearish Engulfing pattern forming at a strong resistance level provides a high-probability sell signal.
The structure confirms the level's strength. For example, a long lower shadow at support shows that buyers defended that level vigorously.
Identifying Reversals and Trend Continuation
Candlestick structure helps you answer two critical questions:
Is the trend about to reverse? Look for reversal patterns (like Hammers, Engulfing) at the end of a trend.
Is the trend pausing before continuing? Sometimes, after a strong move, the market forms small-bodied candles with shadows (like a Spinning Top). This is called consolidation. It indicates indecision and often resolves with a continuation of the prior trend. A strong bullish candle breaking out of this consolidation is a continuation signal.
Risk Management Using Candle Structure
The wicks of candlesticks are excellent tools for placing stop-loss orders.
If you go long (buy) based on a Hammer, a logical stop-loss is placed just below the bottom of the Hammer's long lower shadow. If price moves below that, the bullish signal is invalidated.
If you go short (sell) based on a Shooting Star, a logical stop-loss is placed just above the top of its long upper shadow.
This method ensures your risk is defined by the market's own structure, making your trading more disciplined.
Common Mistakes Traders Make
Even with a solid understanding of candlestick anatomy, traders can fall into common traps.
Ignoring Candle Context
This is the #1 mistake. A bullish candle in the middle of a strong downtrend is not a buy signal; it's likely a "dead cat bounce." Always ask: "Where is this candle located within the broader trend and relative to key levels?"
Over-reliance on a Single Candle
While powerful, single candles should not be used in isolation. A single Doji can mean indecision, but three Dojis in a row signal extreme indecision and a potential major reversal. Look for confirmation from subsequent candles or other technical tools.
Misreading Shadows and Bodies
A candle with a long upper shadow and long lower shadow but a small body (a "Long-Legged Doji") shows massive indecision, not a reversal on its own. Similarly, a candle with a large body but no wicks (a "Marubozu") shows extreme conviction, but if it occurs after a long run, it could signal an exhaustion move, not a continuation.
Candlestick Analysis Across Different Markets
The principles of candlestick structure are universal, but their application can have slight nuances depending on the market.
Forex: The forex market is highly liquid, leading to clean candlestick patterns with less noise. Wicks often form at key psychological levels (e.g., 1.2000).
Stocks: Stock candlesticks can be influenced by company-specific news (earnings), causing large gaps and volatile candles. Volume confirmation is highly recommended when trading candlestick patterns in stocks.
Crypto: The crypto market is open 24/7, so there are no gaps between sessions. It is also highly volatile, which can lead to candles with very long wicks (liquidity sweeps) and large bodies. Risk management is paramount.
Commodities: Like forex, commodities often respect technical levels well. Patterns can be reliable, but traders should be aware of fundamental drivers like supply reports.
Practical Tips and Examples for Chart Reading
Let's put theory into practice with a step-by-step approach to reading a chart.
Step-by-Step Chart Reading Using Candle Anatomy
Identify the Overall Trend: Look left on your chart. Are the candles making higher highs and higher lows (uptrend) or lower highs and lower lows (downtrend)? Are most of the bodies green or red?
Mark Key Support and Resistance Levels: Draw horizontal lines at price levels where the market has previously reversed. Notice how long wicks often cluster at these levels.
Scan for Candlestick Patterns: Zoom in. Look for the single and multi-candle patterns we discussed. Are they forming at your key levels?
Plan Your Trade: If you see a bullish pattern at support, plan a long entry. Your stop-loss goes below the pattern's low (often using the lower shadow), and your profit target could be at the next resistance level.
Wait for Confirmation: Don't jump the gun. Wait for the candle to close to confirm its structure. A candle can look like a Hammer mid-session but turn into something entirely different by the close.
Paper Trading Exercises
The One-Hour Drill: Open a chart on a demo trading account. Spend one hour just labeling candles. Point out: "This is a bullish candle with a long body and small wicks." "This is a Doji with a small body." This builds pattern recognition muscle memory.
Pattern Hunt: Go through historical data on different assets. Find 10 clear Hammer patterns and note what happened in the next 3-5 candles. Do the same for Engulfing patterns and Shooting Stars.
Integrating Candlestick Analysis with Indicators
Candlesticks are best used in conjunction with other tools for confirmation.
Trend-Following Indicators: Use a moving average (e.g., 50-period EMA) to define the trend. Then, only take candlestick buy signals when price is above the average, and sell signals when below.
Momentum Oscillators: If you see a bullish Hammer at support, check the RSI. If the RSI is also in oversold territory (<30), it adds confidence to the reversal signal.
Conclusion
The journey to mastering market analysis begins with a single candle. Understanding candlestick structure—the significance of the body and wick, the meaning of candle colors, and the raw data of open high low close—is not just an academic exercise. It is the first and most crucial step towards becoming a proficient price action trader.
You have now learned the alphabet of this visual language. You know that a long bullish candle signifies conviction, a long upper shadow signifies rejection, and a small body signifies indecision. You can recognize how these basic building blocks form the powerful patterns that traders have relied on for centuries.
The key takeaways are simple:
Context is everything. Always interpret candles within their trend and at key levels.
Practice is non-negotiable. Spend time on charts every day.
Combine tools. Use candlestick structure as the core of your analysis, supported by other concepts like support/resistance and indicators.
Do not be overwhelmed. Start small. Open a chart today and identify just five bullish candles and five bearish candles. Tomorrow, look for a Hammer. The market's story is waiting to be read, and you now have the key to begin deciphering it.
About the Creator
MEXQUICK
Beyond Market Move - At MEXQuick, we combine smart trading infrastructure with global market access — offering users a seamless way to trade, learn, and grow. MEXQuick News & MEXQuick News
Reducing AI Integration Failures by 40% With the Right Generative AI Consulting Partner
In the rush to adopt cutting-edge technologies, many organizations have jumped into artificial intelligence projects without a solid strategy, experienced guidance, or realistic expectations. As a result, a growing number of businesses report stalled initiatives, failed integrations, or tools that never deliver meaningful ROI. But when organizations align with the right generative ai consulting services, the narrative changes — often dramatically. With expert support, companies can reduce AI integration failures by up to 40% and unlock the full potential of intelligent systems.
By Steve Waugh2 days ago in 01
Why High-Quality Carpets Matter for Masjid Interiors
The interior of a masjid is more than just a physical space. It is a place of worship, reflection, unity, and peace. Every design choice within this sacred environment plays a role in shaping the experience of those who enter. Among these choices, carpeting holds a uniquely important position. It directly affects comfort, focus, aesthetics, and the overall spiritual atmosphere. Investing in high-quality carpets is not simply a design decision but a long-term commitment to the well-being of the community.
By Cavalier Carpets5 days ago in 01


Comments
There are no comments for this story
Be the first to respond and start the conversation.